Excel · PDF · 18 pages
10 Power Query Patterns Every Analyst Should Know
Ten core Power Query patterns with visuals, examples and common mistakes.
 Download original guide
Inside the guide
10 Power Query Patterns Every Analyst Should Know Expanded guide with visuals, examples, pitfalls, and practical workflow notes
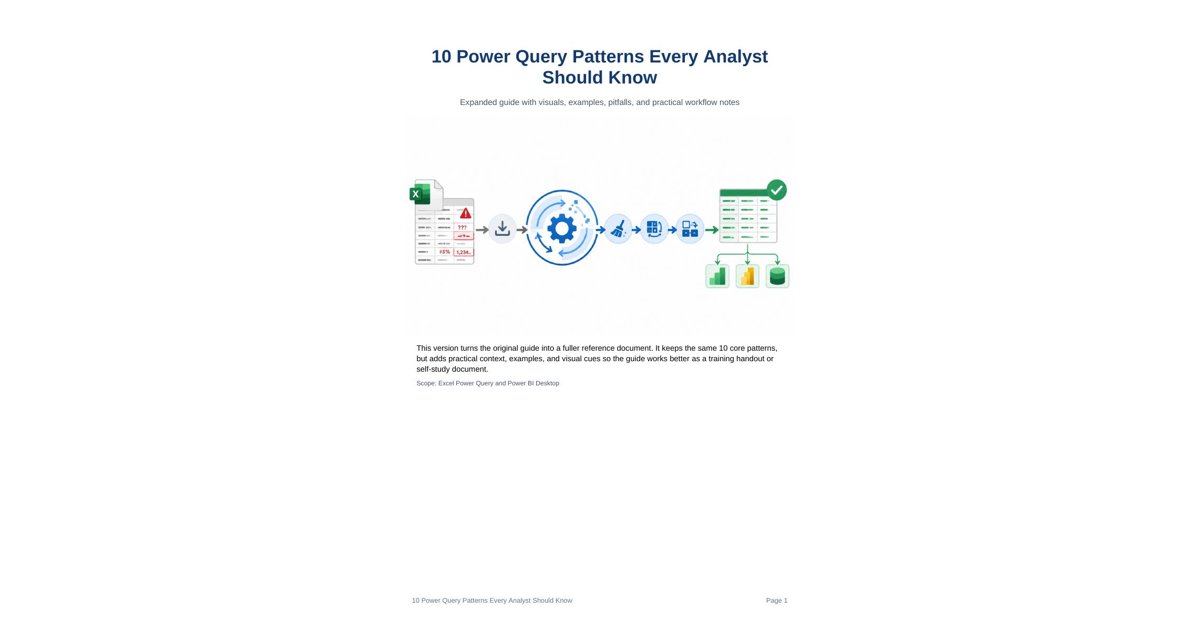
This version turns the original guide into a fuller reference document. It keeps the same 10 core patterns, but adds practical context, examples, and visual cues so the guide works better as a training handout or self-study document. Scope: Excel Power Query and Power BI Desktop
10 Power Query Patterns Every Analyst Should Know Page 1
Contents 1. Pattern 1: Merge Queries 2. Pattern 2: Unpivot 3. Pattern 3: Group By 4. Pattern 4: Conditional Columns 5. Pattern 5: Fill Down / Fill Up 6. Pattern 6: Split and Extract 7. Pattern 7: Date Intelligence Calendar 8. Pattern 8: Parameters and Dynamic Sources 9. Pattern 9: Error Handling and Data Type Safety 10. Pattern 10: Reusable M Functions
Quick reference at the end
10 Power Query Patterns Every Analyst Should Know Page 2
Why these patterns matter Power Query is most valuable when you recognize repeated transformation patterns instead of treating every dataset as a brand new problem. Once these patterns become familiar, you spend less time cleaning manually and more time designing a repeatable pipeline. The biggest win is consistency. A good Power Query workflow makes the source, the cleaning steps, and the output easier to review, audit, and refresh later.
10 Power Query Patterns Every Analyst Should Know Page 3
Visual reference: Merge Queries and join behavior
This visual is useful when explaining why Merge Queries is not just a lookup. It is a structured join operation that can preserve left-side rows, return only overlaps, or surface mismatches for auditing.
10 Power Query Patterns Every Analyst Should Know Page 4
Pattern 1: Merge Queries The VLOOKUP killer for relational data Use merge queries when two tables need to be matched by key, especially when the dataset is large or when auditability matters.
• Best for lookups, dimensional enrichment, and exception lists. • Supports Left Outer, Inner, Full Outer, Left Anti, and Right Anti style logic. • Scales better than worksheet formulas when rows become large. Example: Example: transactions table + product master table, merged by Product ID. Common pitfall: Common mistake: merging on inconsistent text formats, such as spaces, casing, or mixed data types.
10 Power Query Patterns Every Analyst Should Know Page 5
Pattern 2: Unpivot Convert report-shaped data into analysis-ready data Unpivot is the cleanest way to turn month columns, category columns, or period columns into a normalized long table.
• Ideal for cross-tab exports and legacy report layouts. • Creates tidy data with one variable per column and one observation per row. • Makes charts, pivots, filters, and models much easier downstream. Example: Example: Jan to Dec columns become Month and Value columns. Common pitfall: Do not unpivot identifier columns that should remain fixed, such as Name, Department, or SKU.
Visual reference: Unpivot from wide to long
10 Power Query Patterns Every Analyst Should Know Page 6
10 Power Query Patterns Every Analyst Should Know Page 7
Pattern 3: Group By Pre-aggregate before loading to the model Group By is useful when you want totals, averages, counts, or max and min values without using a PivotTable layer. • Great for summary tables and data reduction. • Can perform several aggregations in one step. • Helps shrink data volume before it reaches the model. Example: Example: sales by region with total revenue, average order value, and transaction count. Common pitfall: If you still need row-level detail later, keep the raw table too.
10 Power Query Patterns Every Analyst Should Know Page 8
Pattern 4: Conditional Columns Build rule-based categories cleanly Conditional columns let you classify rows using business rules such as thresholds, flags, tiers, and routing logic. • Useful for segmentation, labels, and yes or no flags. • Easy to update when the rule set is simple. • For complex logic, M code can express nested branches more clearly. Example: Example: Amount above 10000 becomes Large, 1000 to 9999 becomes Medium, otherwise Small. Common pitfall: If thresholds change frequently, move them into a rules table instead of hard-coding them.
10 Power Query Patterns Every Analyst Should Know Page 9
Pattern 5: Fill Down / Fill Up Repair sparse reports and hierarchical exports Fill Down propagates values into blank cells, which is helpful when reports repeat a label only once for multiple rows. • Very common in exported ledgers, nested reports, and grouped operational extracts. • Fills missing labels so every row becomes self-describing. • Should be used only after total rows and subtotal rows are removed. Example: Example: one Region row followed by multiple blank rows under that same Region. Common pitfall: If totals are still present, you may accidentally spread a total label into detail rows.
10 Power Query Patterns Every Analyst Should Know Page 10
Pattern 6: Split and Extract Parse messy text into usable columns Split Column and Extract are your main tools for breaking apart composite strings, IDs, codes, and names. • Use delimiter-based splitting for predictable separators. • Use extract when you only need the left or right side of a string. • Column From Examples can help when the pattern is messy but still consistent enough. Example: Example: INV-2026-001|URGENT becomes invoice number and priority label. Common pitfall: Be careful with names and addresses, because spaces are not always safe delimiters.
10 Power Query Patterns Every Analyst Should Know Page 11
Pattern 7: Date Intelligence Calendar Create a time spine for analysis A date dimension gives you year, quarter, month name, fiscal period, week number, and other calendar attributes in one reusable table. • Important for time intelligence across Excel and Power BI. • Makes date-based filtering and grouping consistent. • Supports fiscal years, holidays, and custom calendars. Example: Example: one Date table joined to every fact table on Date. Common pitfall: Do not rely on transaction dates alone if you need a consistent reporting calendar. Date dimensions are especially powerful because they create a stable time structure that every report can reuse, which reduces inconsistent calendar logic across workbooks.
10 Power Query Patterns Every Analyst Should Know Page 12
Pattern 8: Parameters and Dynamic Sources Make queries reusable and maintainable Parameters let one query work across many files, folders, dates, and environments. • Useful for changing file paths and month folders without editing logic. • Improves reproducibility and reduces manual errors. • Can be tied to cell values or settings tables for easier user control. Example: Example: one folder query that reads monthly files based on a parameter value. Common pitfall: Avoid hard-coded paths because they break the moment the file moves.
10 Power Query Patterns Every Analyst Should Know Page 13
Pattern 9: Error Handling and Data Type Safety Protect the refresh pipeline A single bad value should not destroy a refresh. Defensive transformations catch and manage errors before they spread.
• Replace errors with nulls or safe defaults where appropriate. • Convert types in a controlled sequence. • Add audit columns to isolate problematic rows. Example: Example: text in a numeric column is flagged and reviewed rather than crashing the query. Common pitfall: Never hide errors blindly if they represent data quality issues that matter.
Visual reference: error handling and data quality pipeline
10 Power Query Patterns Every Analyst Should Know Page 14
10 Power Query Patterns Every Analyst Should Know Page 15
Pattern 10: Reusable M Functions Stop repeating the same ETL steps A function turns a repeated query pattern into one reusable unit that can be called against many files or sources.
• Excellent for standardized file ingestion. • Keeps logic centralized and easier to maintain. • Works well when one process must be applied to many inputs. Example: Example: one cleaning function applied to every file in a folder. Common pitfall: If the function becomes too complex, document the input and output clearly.
Visual reference: reusable functions across multiple sources
10 Power Query Patterns Every Analyst Should Know Page 16
10 Power Query Patterns Every Analyst Should Know Page 17
Best practices across the full workflow Area Best practice Why it matters
Scalability Prefer query folding and pre-aggregation where possible Keeps refresh times manageable as data grows
Stability Handle errors and type changes deliberately Prevents one bad value from breaking the full pipeline
Maintainability Use parameters and functions for repeatable logic Reduces copy-paste work and future cleanup
Data shape Normalize report-style layouts early Long, tidy data is easier to model and visualize
Quick note: the best workflow is usually not one magical transformation. It is a sequence: ingest, clean, reshape, validate, parameterize, and then reuse.
Quick reference cheat sheet Pattern When to use it
Merge Queries Match and enrich one table from another
Unpivot Turn wide reports into long analysis-ready data
Group By Create summary tables before loading
Conditional Columns Classify rows using business rules
Fill Down / Fill Up Repair sparse report exports
Split and Extract Parse composite text values
Date Calendar Build time intelligence once and reuse it
Parameters Reuse one query across files and folders
Error Handling Keep bad data from breaking refresh
Functions Package repeatable logic into a reusable step
Bottom line: once you know these 10 patterns, Power Query stops feeling like a menu and starts behaving like an ETL toolkit.
10 Power Query Patterns Every Analyst Should Know Page 18