Strategy · PDF · 14 pages
From Metrics to Decisions: The KPI Ladder Framework
How raw data climbs into metrics, KPIs and finally real business decisions.
 Download original guide
Inside the guide
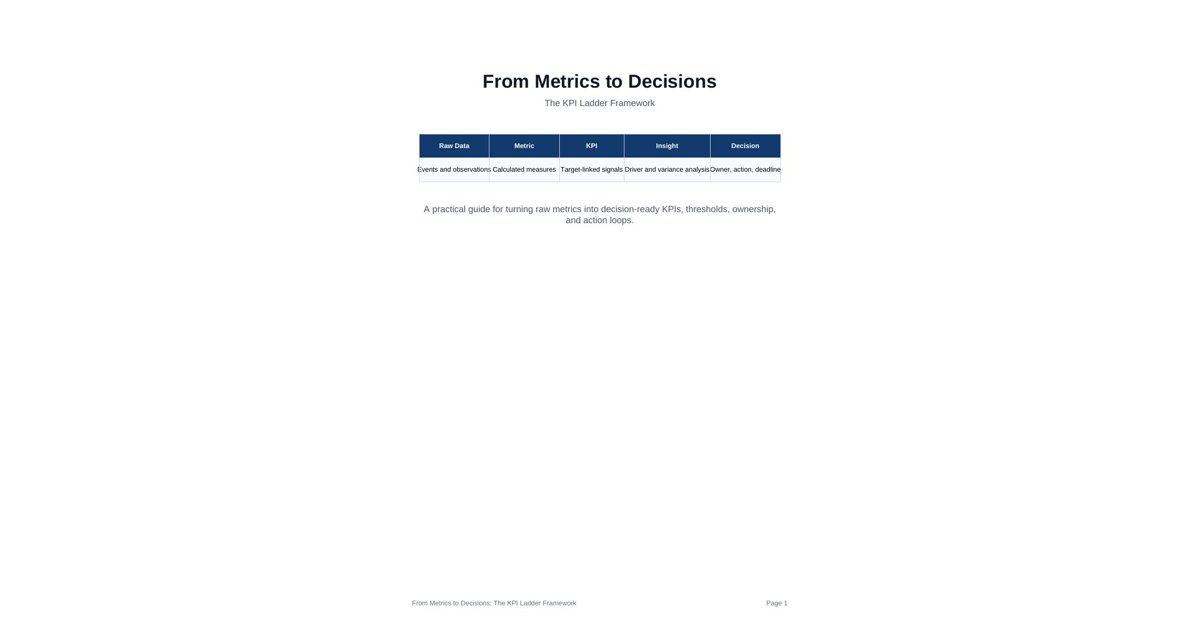
From Metrics to Decisions The KPI Ladder Framework
Raw Data Metric KPI Insight Decision
Events and observations Calculated measures Target-linked signals Driver and variance analysisOwner, action, deadline
A practical guide for turning raw metrics into decision-ready KPIs, thresholds, ownership, and action loops.
From Metrics to Decisions: The KPI Ladder Framework Page 1
Contents 1. Why most dashboards stop at metrics
2. The KPI ladder model
3. Data point, metric, KPI, insight, decision
4. Selecting the right metrics for each layer
5. Thresholds, targets, and exception logic
6. Ownership and accountability
7. Executive, operational, and team views
8. Common anti-patterns
9. A practical implementation blueprint
10. Example framework by business function
11. Sample KPI ladder template
12. Final checklist and next steps
From Metrics to Decisions: The KPI Ladder Framework Page 2
1. Why most dashboards stop at metrics Many dashboards look sophisticated but do not help anyone decide what to do next. They show activity, volume, and trends, but leave the reader to do the translation from measurement to action.
That is the core problem the KPI ladder solves. It creates a hierarchy that moves from raw data, to interpreted metrics, to decision-level KPIs, then to insights and finally to action.
If a chart cannot answer a question, or trigger a choice, it is probably only a metric and not yet a KPI.
Too many signals Noise Decision fatigue
Fewer signal-rich KPIs Focus Faster action
The best dashboards reduce work. They do not ask executives to think harder, they help them think faster.
From Metrics to Decisions: The KPI Ladder Framework Page 3
2. The KPI ladder model The ladder is a simple mental model with five levels. Each level answers a different question, and each level deserves a different visual treatment.
Level Purpose Typical question Output
Data point Raw observation What was captured? Single record or event
Metric Calculated measure What happened in volume or value? Rate, count, amount, ratio
KPI Goal-linked measure Are we on track? Targeted and thresholded metric
Insight Interpretation Why did this happen? Trend, variance, driver, anomaly
Decision Action guidance What should we do now? Owner, action, deadline, priority
The most important design choice is not the chart, it is the level. Many teams try to make every metric a KPI, which floods the viewer with noise and weakens attention.
A useful rule is to keep the executive layer small. If a senior leader sees more than seven to ten primary KPIs, the dashboard usually needs simplification.
From Metrics to Decisions: The KPI Ladder Framework Page 4
3. Data point, metric, KPI, insight, decision These words are often used interchangeably, but they should not be. When teams blur the differences, dashboards become inconsistent and every meeting turns into a debate about definitions instead of decisions.
Data point A data point is a raw observation. It may be a transaction, a click, a support ticket, a shipment, or a payment. On its own it has no business meaning yet.
Metric A metric is a calculation over data points. Examples include revenue, average order value, close rate, or delivery time. A metric is measurable, but not automatically decision-worthy.
KPI A KPI is a metric tied to an objective, target, or threshold. It tells the organization whether performance is acceptable, behind, or ahead of plan.
Insight An insight explains the metric. It identifies the driver, the anomaly, the trend, or the change in mix that matters. The insight is what turns the KPI into something actionable.
Decision A decision states the next action, the owner, and the due date. This is where dashboards become management tools instead of passive reports.
A practical KPI ladder is not a hierarchy of prettier charts. It is a hierarchy of questions: what happened, what it means, why it matters, and what to do now.
From Metrics to Decisions: The KPI Ladder Framework Page 5
4. Selecting the right metrics for each layer A strong KPI ladder uses a small set of decision-grade KPIs supported by a wider set of diagnostic metrics. That keeps the top level concise while still giving analysts enough depth to investigate problems.
Layer Good examples Avoid
Operational metrics Calls handled, orders shipped, tickets closed Too many daily counters without context
Diagnostic metrics Conversion rate, defect rate, price mix, ticket ageing Metrics with no link to a root cause
Leading indicators Pipeline coverage, website traffic, forecast accuracy Weak proxies that never change behavior
Lagging indicators Revenue, gross margin, churn, net income Metrics that arrive too late for action
Decision KPIs EBITDA vs target, SLA breach rate, retention vs plan Everything at once A practical rule is to keep the executive layer small. If a senior leader sees more than seven to ten primary KPIs, the dashboard usually needs simplification.
The ladder should also reflect time horizon. Operational metrics are often daily or weekly, while decision KPIs may be monthly or quarterly.
From Metrics to Decisions: The KPI Ladder Framework Page 6
5. Thresholds, targets, and exception logic A KPI without a target is only a statistic. A KPI without a threshold is hard to interpret. Good frameworks define what good, warning, and critical mean before the dashboard is published.
Threshold logic is what turns a metric into a management signal. It answers whether the number deserves attention, and if so, how urgent that attention should be.
Status Meaning Suggested action
Green Within acceptable range Monitor, no escalation needed
Amber Outside normal range but manageable Investigate, assign an owner
Red Beyond tolerance or critical risk Escalate, define immediate action Thresholds should be reviewed over time. If every KPI is always green, the thresholds are probably too loose. If everything is red, the thresholds are probably not realistic.
The most useful thresholds are those that can trigger a different conversation, a different owner, or a different action.
From Metrics to Decisions: The KPI Ladder Framework Page 7
6. Ownership and accountability A KPI becomes useful when someone owns it. Ownership means one person or team is responsible for understanding the signal, communicating the reason, and driving the response.
Field Example
Owner VP Sales
Cadence Weekly review, monthly executive summary
Trigger Retention falls below target by 2 points
Action Launch account recovery program
Decision Increase customer success coverage Each KPI should answer four questions: who owns it, how often it is reviewed, what action happens when it moves, and what decision it influences.
If nobody owns a KPI, nobody changes behavior when it moves.
From Metrics to Decisions: The KPI Ladder Framework Page 8
7. Executive, operational, and team views Not every audience needs the same ladder depth. Executives care about the few indicators that define success. Managers need the drivers behind those indicators. Teams need the operational levers they can actually move.
Audience What they need Typical detail level
Executive One page, directional KPIs, exceptions, decisions Very high level
Manager Drivers, trends, drill-down views, actions Moderate
Analyst Complete metric set, definitions, source detail High A layered dashboard often works best. The top layer is the KPI view, the second layer is the diagnostic view, and the third layer is the operational or transaction detail.
The ladder is not only about data. It is also about how much ambiguity each audience can tolerate before they need to drill deeper.
From Metrics to Decisions: The KPI Ladder Framework Page 9
8. Common anti-patterns • Too many KPIs on one screen, which dilutes attention.
• Metrics without targets, which makes interpretation subjective.
• Only lagging indicators, which arrive after action is too late.
• Color overload, which turns the dashboard into visual noise.
• No owner, which means no accountability for response.
• No definitions, which creates endless debates about what the number means.
• No decision path, which leaves the team informed but inactive.
The strongest dashboards are not the busiest ones. They are the ones where every element earns its place by helping a decision happen faster.
A good test is simple: if you remove a KPI and nothing changes in the meeting, it probably was not a KPI.
From Metrics to Decisions: The KPI Ladder Framework Page 10
9. A practical implementation blueprint To implement the KPI ladder, start with business outcomes, not data availability. Define the goal, then identify the few metrics that truly measure progress toward that goal, then choose the thresholds and actions.
A clean implementation flow looks like this: 1. Define the business objective 2. Identify the lead and lag measures 3. Select the KPI candidates 4. Set target, tolerance, and escalation bands 5. Assign owners and review cadence 6. Build the executive view 7. Add diagnostic drill-downs 8. Test with real users 9. Refine based on decisions made
That sequence matters. If you start with visuals before definitions, you usually end up redesigning the dashboard later.
Suggested data model fields: Field Purpose
kpi_name Human-readable KPI label
metric_formula How the number is calculated
target_value Desired performance level
threshold_green Upper or lower green band
threshold_amber Warning band
threshold_red Escalation band
owner Accountable person or function
cadence Review frequency
decision_link What action the KPI influences
From Metrics to Decisions: The KPI Ladder Framework Page 11
10. Example framework by business function Function Decision KPI Diagnostic metrics Decision outcome
Sales Revenue growth Pipeline coverage, win rate, average deal size Increase top-line conversion
Customer Success Net retention Adoption, health score, churn risk, response time Protect and expand recurring revenue
Operations On-time delivery Cycle time, bottleneck rate, defect rate Improve reliability and throughput
Finance EBITDA margin Gross margin, OPEX ratio, working capital Strengthen profitability and control
Product Activation rate Feature usage, time-to-value, cohort retention Increase product stickiness This is the practical value of the ladder. Each function gets one or two decision KPIs, then a supporting set of metrics that explain movement without drowning the reader.
Finance might focus on margin and cash, while operations might focus on delivery reliability and cycle time. The ladder stays the same, but the content changes with the business objective.
From Metrics to Decisions: The KPI Ladder Framework Page 12
11. Sample KPI ladder template You can use a template like this to define each KPI before it is shown on a dashboard.
Template field Example
Business objective Improve profitable growth
KPI name Gross margin %
Definition Gross profit divided by revenue
Target 42 percent
Green range 42 percent and above
Amber range 39 percent to 42 percent
Red range Below 39 percent
Owner Finance Director
Cadence Weekly review, monthly exec review
Primary actions Pricing review, mix analysis, cost control
Decision linked to Margin protection plan A template like this forces discipline. It prevents the dashboard from becoming a collection of miscellaneous charts with no common language.
It also creates consistency across teams, so the executive layer can compare performance without re-learning the meaning of every panel.
From Metrics to Decisions: The KPI Ladder Framework Page 13
12. Final checklist and next steps • Each KPI is linked to a business objective.
• Every KPI has a target and threshold bands.
• Every KPI has an owner and review cadence.
• The executive view is short and focused.
• Drill-downs exist for diagnosis, not clutter.
• The dashboard clearly shows what changed and why.
• Each key signal leads to an action or decision.
Final takeaway The KPI ladder framework turns a dashboard from a measurement surface into a decision system. When the organization knows what each layer means, who owns it, and what action it should trigger, metrics stop being passive numbers and start becoming management leverage.
If you want a dashboard people actually read, keep the top layer small, the meaning explicit, and the action path visible.
That is how raw data becomes better decisions.
From Metrics to Decisions: The KPI Ladder Framework Page 14