Finance · PDF · 6 pages
Designing a P&L Dashboard Executives Actually Read
A masterclass in financial clarity — what to show leaders so they can decide fast.
 Download original guide
Inside the guide
Designing a P&L; Dashboard Executives Actually Read
A Masterclass in Financial Clarity and Executive Decision Support
1. Executive Dashboards: The Clarity Gap Most financial dashboards fail not because they lack data, but because they lack context. Executives operate in a high-pressure environment where time is the most expensive resource. They do not want to 'mine' for insights; they want the insights delivered to them on a silver platter.
The gap usually exists between 'What happened' (the raw numbers) and 'Why it happened' (the driver analysis). A successful dashboard bridges this gap by focusing on variances, trends, and actionable narratives.
Design for a CEO, not an accountant.
2. The 1-3-10 Rule: Design for Attention
The 1-3-10 Rule is a hierarchy of information consumption:
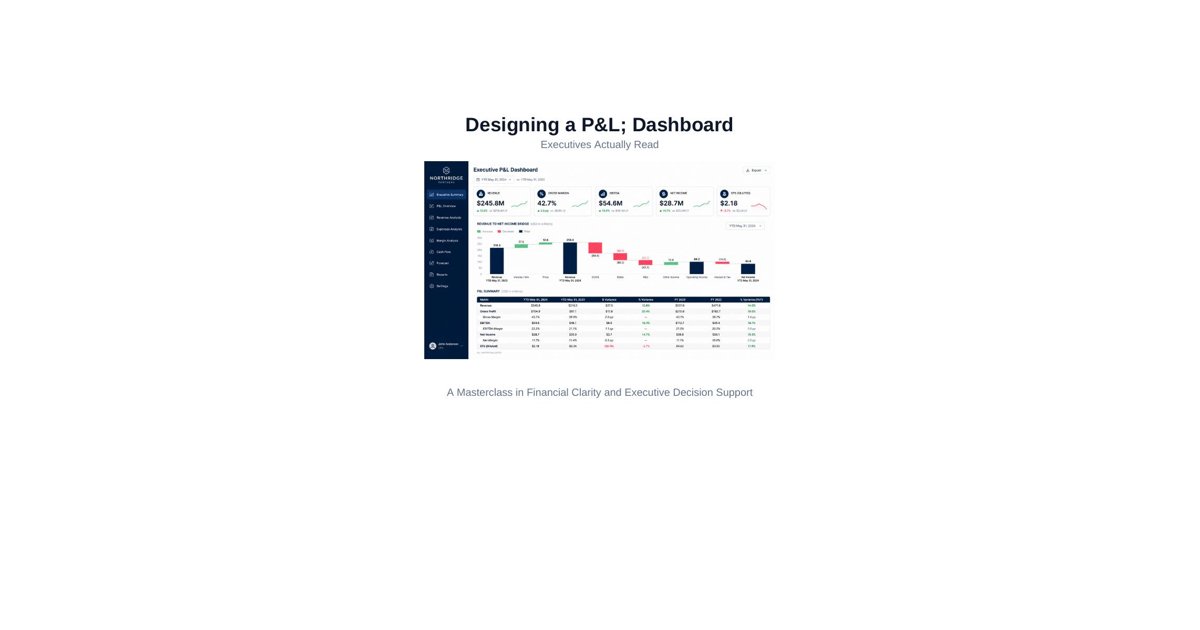
• 1 Second: The Status. The executive should know if the month was good or bad within one second. This is achieved via high-level KPI cards with color-coded variances. • 3 Seconds: The Trend. In three seconds, they should understand the direction. Are we improving? Is the variance a one-off or a trend? Line charts and sparklines do the heavy lifting here. • 10 Seconds: The Detail. By ten seconds, they should see the root cause. This is where bridge charts and top-down tables provide the 'where' and 'how' behind the performance.
3. Bridge to the Truth: Using Waterfall Charts
A P&L; is a story of movement. A waterfall chart (or bridge chart) is the most powerful tool to tell that story visually. It moves the eye logically from Revenue down to Net Income, highlighting where value was created or lost along the way.
Key bridges to build:
• Revenue to EBITDA Bridge: Shows the impact of COGS and OPEX. • Budget vs. Actual Bridge: Highlights exactly which departments or cost centers overspent or outperformed expectations. • Price-Volume-Mix Bridge: Explains if revenue growth was driven by selling more (Volume), charging more (Price), or selling more profitable products (Mix).
4. Color as a Compass, Not a Decoration
Color should be used sparingly and strategically. Avoid the 'Christmas Tree' effect—too much bright red and green creates visual fatigue and hides the real signal.
Professional Color Principles:
• Use muted tones: Soft emerald for favorable, soft coral for unfavorable. Muted navy for totals. • Semantic Consistency: Never use red for growth if growth is the goal. Never use green for expenses increasing. • Use Heatmaps: For large tables, use background shading (conditional formatting) to guide the eye to the largest relative variances immediately.
5. The Narrative Advantage
Numbers without a narrative are just digits. The 'Actions' or 'Commentary' section is often the most read part of an executive dashboard. It should answer three questions:
1. What happened? (e.g., 'Revenue is up 12% vs. Budget') 2. Why did it happen? (e.g., 'Driven by the early launch of Product X and higher retention in EMEA') 3. What are we doing about it? (e.g., 'Increasing marketing spend in EMEA to capitalize on the trend')
Executive clarity beats data depth every time.
6. The Executive Shortlist: Essential P&L; KPIs KPI Executive Significance Visual Recommendation
Revenue Top-line growth / Market health Gauge or KPI Card Gross Margin % Pricing power & Production efficiency Trend Line OPEX Ratio Internal discipline & Efficiency Stacked Bar EBITDA Core operating profitability Waterfall Chart Net Income The bottom line / Ultimate result KPI Card Variance to Budget Predictability & Control Bullet Chart
Conclusion An executive P&L; dashboard is a communication tool, not just a data repository. By applying the 1-3-10 rule, using strategic bridges, and emphasizing narrative over raw data, you turn a standard report into a strategic asset.
Master the 'Why', and the 'What' will take care of itself.