Analytics · PDF · 5 pages
Data Analytics & Architecture Cheat Sheets
8 advanced analytics topics, the key rules we follow and a system diagram for each.
 Download original guide
Inside the guide
DATA ANALYTICS & ARCHITECTURAL SYSTEMS PLAYBOOK ADVANCED TECHNICAL REFERENCE
DATA ANALYTICS & ARCHITECTURAL SYSTEMS PLAYBOOK 8 Advanced Technical Topics • Core Execution Rules • Architectural System Diagrams
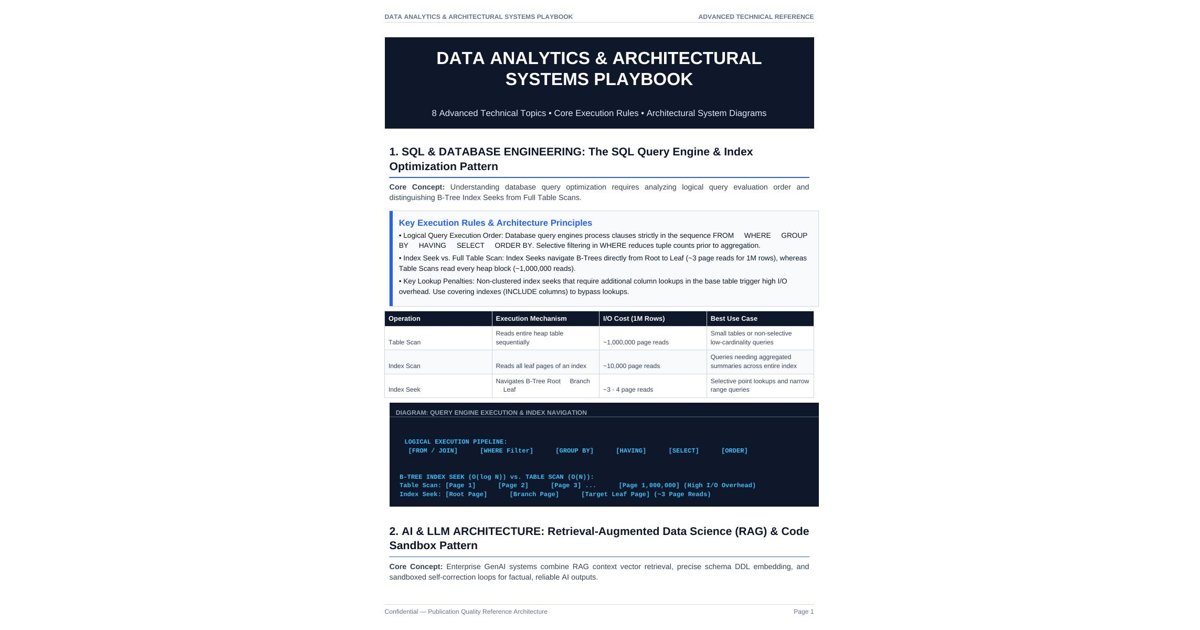
1. SQL & DATABASE ENGINEERING: The SQL Query Engine & Index Optimization Pattern Core Concept: Understanding database query optimization requires analyzing logical query evaluation order and distinguishing B-Tree Index Seeks from Full Table Scans.
Key Execution Rules & Architecture Principles • Logical Query Execution Order: Database query engines process clauses strictly in the sequence FROM ➔ WHERE ➔ GROUP BY ➔ HAVING ➔ SELECT ➔ ORDER BY. Selective filtering in WHERE reduces tuple counts prior to aggregation. • Index Seek vs. Full Table Scan: Index Seeks navigate B-Trees directly from Root to Leaf (~3 page reads for 1M rows), whereas Table Scans read every heap block (~1,000,000 reads). • Key Lookup Penalties: Non-clustered index seeks that require additional column lookups in the base table trigger high I/O overhead. Use covering indexes (INCLUDE columns) to bypass lookups.
Operation Execution Mechanism I/O Cost (1M Rows) Best Use Case
Reads entire heap table Small tables or non-selective Table Scan sequentially ~1,000,000 page reads low-cardinality queries
Queries needing aggregated Index Scan Reads all leaf pages of an index ~10,000 page reads summaries across entire index
Navigates B-Tree Root ➔ Branch Selective point lookups and narrow Index Seek ➔ Leaf ~3 - 4 page reads range queries
DIAGRAM: QUERY ENGINE EXECUTION & INDEX NAVIGATION ■■■■■■■■■■■■■■■■■■■■■■■■■■■■■■■■■■■■■■■■■■■■■■■■■■■■■■■■■■■■■■■■■■■■■■■■■■■■■■■■■■■■■■ ■■■■ ■ LOGICAL EXECUTION PIPELINE: ■ ■ [FROM / JOIN] ■■■ [WHERE Filter] ■■■ [GROUP BY] ■■■ [HAVING] ■■■ [SELECT] ■■■ [ORDER] ■ ■■■■■■■■■■■■■■■■■■■■■■■■■■■■■■■■■■■■■■■■■■■■■■■■■■■■■■■■■■■■■■■■■■■■■■■■■■■■■■■■■■■■■■ ■■■■ B-TREE INDEX SEEK (O(log N)) vs. TABLE SCAN (O(N)): Table Scan: [Page 1] ■■■ [Page 2] ■■■ [Page 3] ... ■■■ [Page 1,000,000] (High I/O Overhead) Index Seek: [Root Page] ■■■ [Branch Page] ■■■ [Target Leaf Page] (~3 Page Reads)
2. AI & LLM ARCHITECTURE: Retrieval-Augmented Data Science (RAG) & Code Sandbox Pattern Core Concept: Enterprise GenAI systems combine RAG context vector retrieval, precise schema DDL embedding, and sandboxed self-correction loops for factual, reliable AI outputs.
Confidential — Publication Quality Reference Architecture Page 1
DATA ANALYTICS & ARCHITECTURAL SYSTEMS PLAYBOOK ADVANCED TECHNICAL REFERENCE
Key Execution Rules & Architecture Principles • Grounding via Vector Context: Ingest proprietary documents via chunking and vector embedding (watsonx / FAISS / Milvus) to ground LLM context and prevent hallucinations. • System Prompt DDL Embedding: Supply database table schemas (DDL) directly inside system prompts to ensure accurate SQL code generation without schema drift. • Sandboxed Execution & Self-Correction Loop: Execute LLM-generated code inside isolated sandboxes (Docker / gVisor). Catch runtime errors and loop back for automated code correction.
DIAGRAM: RAG & SANDBOXED EXECUTION PIPELINE [User Query] ■■■■■■■ [Embedding Model] ■■■■■■■ [Vector DB Retrieval (Top-K Chunks)] ■ ▼ [System Prompt + DDL Schema] + [Context Chunks] ■■■ [LLM Code Generator] ■ ▼ ■■■■■■■■■■■■■■■■■■■■■■■■■■■■■■■■■■■■■■■■■■■■■■■■■■■■■■■■■■■■■■■■■■■■■■■■■■■ ■ ISOLATED SANDBOX EXECUTION & SELF-CORRECTION LOOP ■ ■ [Run Script] ■■■ Error Detected? ■■■ [Self-Correction Prompt] ■■■ ■ ■ ■ ■ ■ ■ ■■■■ Success ■■■ [Verified Grounded Output] ■■■■■■■■■■■■■ ■ ■■■■■■■■■■■■■■■■■■■■■■■■■■■■■■■■■■■■■■■■■■■■■■■■■■■■■■■■■■■■■■■■■■■■■■■■■■■
3. DATA ARCHITECTURE & LAKEHOUSE: Medallion Lakehouse Pattern: Bronze, Silver & Gold Pipeline Core Concept: The Medallion architecture progressively refines data structure and quality across Bronze (raw), Silver (cleansed), and Gold (curated) layers on Databricks Delta Lake.
Key Execution Rules & Architecture Principles • Bronze Layer (Raw Ingestion): Land source CDC data 'as-is' with ingestion metadata timestamps. Retain immutable history for full auditability and reprocessing. • Silver Layer (Cleansed Enterprise View): Perform deduplication, schema alignment, and 'just-enough' cleansing. Model in 3NF or Data Vault for cross-departmental analytics. • Gold Layer (Curated Datamarts): Transform Silver entities into read-optimized Kimball star-schemas or flattened datamarts for executive reporting and ML features.
Layer Data Quality & Format Primary Target Users Data Modeling Style
Raw, Append-Only, Source Format Source System As-Is Bronze + Metadata Data Engineers / CDC Systems (JSON/Parquet)
Cleansed, Deduplicated, Silver Conformed View Data Scientists / Analysts 3NF / Data Vault / Transactional
Aggregated, Business Rules Gold Applied, Curated Business Users / BI Dashboards Kimball Star-Schema / Datamarts
Confidential — Publication Quality Reference Architecture Page 2
DATA ANALYTICS & ARCHITECTURAL SYSTEMS PLAYBOOK ADVANCED TECHNICAL REFERENCE
DIAGRAM: MEDALLION DATA REFINEMENT FLOW ■■■■■■■■■■■■■■■■■■■■■■■ ■■■■■■■■■■■■■■■■■■■■■■■ ■■■■■■■■■■■■■■■■■■■■■■■ ■ BRONZE LAYER ■ ■ SILVER LAYER ■ ■ GOLD LAYER ■ ■ Raw Ingestion & CDC ■ ■■■ ■ Cleansed Entity View■ ■■■ ■ Star-Schema Marts ■ ■ Immutable History ■ ■ Deduplicated 3NF ■ ■ Executive Analytics ■ ■■■■■■■■■■■■■■■■■■■■■■■ ■■■■■■■■■■■■■■■■■■■■■■■ ■■■■■■■■■■■■■■■■■■■■■■■
4. PYTHON & HPC: Polars Lazy Evaluation & Apache Arrow Memory Pattern Core Concept: Polars leverages a multi-threaded Rust execution engine and Apache Arrow memory layouts to deliver vectorized streaming analytics on large datasets.
Key Execution Rules & Architecture Principles • Polars Rust Core & Multi-Threading: Polars dispatches queries across all CPU cores in Rust without Python GIL contention, beating single-threaded Pandas by 10x-20x. • Lazy Frame Optimization: Use pl.scan_parquet() to allow the query planner to apply predicate pushdown (skipping Parquet row groups) and projection pushdown (reading selected columns). • Zero-Copy Apache Arrow Integration: Standardize on Apache Arrow columnar memory buffers for zero-copy data passing between Polars, DuckDB, and PyArrow.
DIAGRAM: LAZY EVALUATION VS EAGER EXECUTION Pandas (Eager): [Read 50GB Parquet] ■■■ [30GB Python RAM] ■■■ [1 Thread Filter] ■■■ (OOM Risk) Polars (Lazy): [scan_parquet()] ■■■ [Pushdown Optimizer] ■■■ [Multi-Thread Stream] ■■■ (2GB RAM)
5. SPREADSHEET ARCHITECTURE: Dynamic Array Framework & LAMBDA Functions in Excel Core Concept: Modern Microsoft 365 Excel combines Dynamic Arrays, LET variables, and named LAMBDA formulas into functional, modular reporting engines.
Key Execution Rules & Architecture Principles • Dynamic Array Spill Matrix: Write formulas in a single top-left cell; Excel automatically spills results across adjacent rows/columns without manual drag-copying. • Formula Modularity via LET & LAMBDA: Use LET to define named intermediate variables for readability, and LAMBDA to encapsulate reusable custom worksheet functions without macros. • Higher-Order Functional Helpers: Iterate over dynamic arrays efficiently using MAP, REDUCE, SCAN, BYROW, and FILTER to eliminate legacy helper columns.
Confidential — Publication Quality Reference Architecture Page 3
DATA ANALYTICS & ARCHITECTURAL SYSTEMS PLAYBOOK ADVANCED TECHNICAL REFERENCE
DIAGRAM: DYNAMIC SPILL & FUNCTIONAL FORMULA ARCHITECTURE [Single Top-Left Cell Formula] ■■■ =LET(data, tbl, open, FILTER(data, status<>"Closed"), SORT(open)) ■ ▼ [Dynamic Array Spill Range] ■■■■■■■■■■■■■■■■■■■■■■■■■■■■■ ■ Row 1 | Val A | Val B ... ■ ■ Row 2 | Val C | Val D ... ■ ■■■■■■■■■■■■■■■■■■■■■■■■■■■■■
6. DASHBOARD DESIGN & BI: The Pre-Attentive Visual Hierarchy & Executive KPI Grid Pattern Core Concept: Executive dashboards leverage pre-attentive visual processing, inverted pyramid layering, and 3-second variance sparklines for optimal decision velocity.
Key Execution Rules & Architecture Principles • Pre-Attentive Cognitive Processing: Design layouts around 250ms visual cues (color, position, size) to convey status instantly before numerical reading occurs. • F-Pattern & Z-Pattern Scanning: Position the primary KPI in the top-left corner where human visual scanning naturally initiates. • Inverted Pyramid Hierarchy: Structure dashboards in 3 layers: Layer 1 (Status KPIs), Layer 2 (Diagnostic Trends & Sparklines), Layer 3 (Granular Drilldown Tables).
DIAGRAM: VISUAL HIERARCHY & INVERTED PYRAMID LAYOUT [Layer 1: Headline Status KPIs] ■■■■■■■■■■■■■■■ ■■■■■■■■■■■■■■■ ■■■■■■■■■■■■■■■ ■ KPI 1 $4.2M ■ ■ KPI 2 +14% ■ ■ KPI 3 -2.1% ■ ■■■■■■■■■■■■■■■ ■■■■■■■■■■■■■■■ ■■■■■■■■■■■■■■■ ■ (Inverted Pyramid Flow) [Layer 2: Diagnostic Sparklines] ▼ ■■■■■■■■■■■■■■■■■■■■■■■■■■■■■■■■■■■■■■■■■■■■■■■■■ ■ Trend: ▲■■■■■■■/\■■■■■■ (3-sec diagnostic) ■ ■■■■■■■■■■■■■■■■■■■■■■■■■■■■■■■■■■■■■■■■■■■■■■■■■
7. EXPERIMENTATION & CAUSAL INFERENCE: CUPED Variance Reduction & A/B Testing Guardrails Core Concept: Controlled-experiment Using Pre-Experiment Data (CUPED) applies regression adjustments to eliminate pre-existing variance in online experimentation.
Key Execution Rules & Architecture Principles • Pre-Experiment Covariate Adjustment: CUPED utilizes historical pre-period user data (X) to subtract pre-existing variance from post-period metrics (Y). • Variance Reduction Formula: CUPED adjusted metric Y_cuped = Y - θ(X - E[X]), where θ = Cov(Y,X) / Var(X). • Accelerated Test Convergence: Reduces metric variance by up to 40%, enabling A/B tests to reach statistical significance 40% faster with smaller sample sizes.
Confidential — Publication Quality Reference Architecture Page 4
DATA ANALYTICS & ARCHITECTURAL SYSTEMS PLAYBOOK ADVANCED TECHNICAL REFERENCE
DIAGRAM: CUPED PRE-PERIOD VARIANCE ADJUSTMENT PIPELINE Raw Metric (Y) ■■■ High Variance Noise (Pre-existing user differences) ■ Pre-Period (X) ■■■ [CUPED Covariate Adjustment: Y - θ(X - E[X])] ■ ▼ Adjusted Metric ■■■ 40% Lower Variance ■■■ 40% Faster Test Convergence
8. PREDICTIVE ML & FEATURE ENGINEERING: Offline-to-Online Feature Store Pattern for Predictive Pipelines Core Concept: Feature stores unify point-in-time historical batch training with low-latency Redis online serving to eliminate training-serving skew in ML systems.
Key Execution Rules & Architecture Principles • Unified Feature Definition: Define features declaratively in a central registry (e.g. Feast) shared across training and serving. • Point-in-Time Point Joins: Generate offline training datasets via exact point-in-time joins on historical batch tables (Amazon Redshift/S3) to eliminate data leakage. • Sub-10ms Real-Time Serving: Materialize latest feature vectors into Redis in-memory key-value stores for sub-10ms online inference serving.
DIAGRAM: OFFLINE-TO-ONLINE FEATURE MATERIALIZATION FLOW [Historical Batch Data] ■■■ [Offline Store (Redshift/S3)] ■■■ Point-in-Time Join ■■■ [Model Training] ■ (Materialization) ▼ [Online Store (Redis Hash)] ■■■ Sub-10ms Retrieval ■■■ [Real-Time Inference]
Confidential — Publication Quality Reference Architecture Page 5