Architecture · PDF · 4 pages
Data & Analytics Architectural Playbook
8 production design patterns — SQL query engines, index optimisation and more, with diagrams.
 Download original guide
Inside the guide
DATA & ANALYTICS ARCHITECTURAL PLAYBOOK 8 Production-Grade Design Patterns, Optimization Workflows & System Diagrams
SQL & DATABASE ENGINEERING
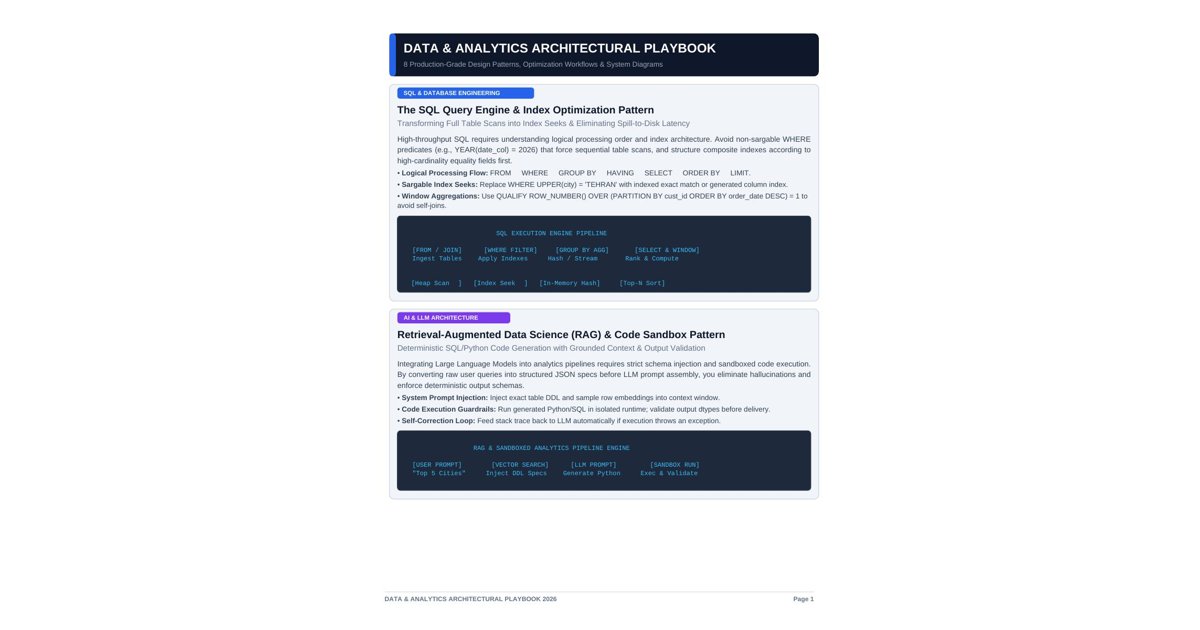
The SQL Query Engine & Index Optimization Pattern Transforming Full Table Scans into Index Seeks & Eliminating Spill-to-Disk Latency High-throughput SQL requires understanding logical processing order and index architecture. Avoid non-sargable WHERE predicates (e.g., YEAR(date_col) = 2026) that force sequential table scans, and structure composite indexes according to high-cardinality equality fields first. • Logical Processing Flow: FROM ➔ WHERE ➔ GROUP BY ➔ HAVING ➔ SELECT ➔ ORDER BY ➔ LIMIT. • Sargable Index Seeks: Replace WHERE UPPER(city) = 'TEHRAN' with indexed exact match or generated column index. • Window Aggregations: Use QUALIFY ROW_NUMBER() OVER (PARTITION BY cust_id ORDER BY order_date DESC) = 1 to avoid self-joins.
■■■■■■■■■■■■■■■■■■■■■■■■■■■■■■■■■■■■■■■■■■■■■■■■■■■■■■■■■■■■■■■■■■■■■■■■■■■■■■■ ■ SQL EXECUTION ENGINE PIPELINE ■ ■■■■■■■■■■■■■■■■■■■■■■■■■■■■■■■■■■■■■■■■■■■■■■■■■■■■■■■■■■■■■■■■■■■■■■■■■■■■■■■ ■ [FROM / JOIN] ■ ➔ [WHERE FILTER]■ ➔ [GROUP BY AGG] ■ ➔ [SELECT & WINDOW] ■ ■ Ingest Tables ■ Apply Indexes ■ Hash / Stream ■ Rank & Compute ■ ■■■■■■■■■■■■■■■■■■■■■■■■■■■■■■■■■■■■■■■■■■■■■■■■■■■■■■■■■■■■■■■■■■■■■■■■■■■■■■■ ■ ■ ■ ■ [Heap Scan ■] [Index Seek ■] [In-Memory Hash] [Top-N Sort]
AI & LLM ARCHITECTURE
Retrieval-Augmented Data Science (RAG) & Code Sandbox Pattern Deterministic SQL/Python Code Generation with Grounded Context & Output Validation Integrating Large Language Models into analytics pipelines requires strict schema injection and sandboxed code execution. By converting raw user queries into structured JSON specs before LLM prompt assembly, you eliminate hallucinations and enforce deterministic output schemas. • System Prompt Injection: Inject exact table DDL and sample row embeddings into context window. • Code Execution Guardrails: Run generated Python/SQL in isolated runtime; validate output dtypes before delivery. • Self-Correction Loop: Feed stack trace back to LLM automatically if execution throws an exception.
■■■■■■■■■■■■■■■■■■■■■■■■■■■■■■■■■■■■■■■■■■■■■■■■■■■■■■■■■■■■■■■■■■■■■■■■■■■■■■■ ■ RAG & SANDBOXED ANALYTICS PIPELINE ENGINE ■ ■■■■■■■■■■■■■■■■■■■■■■■■■■■■■■■■■■■■■■■■■■■■■■■■■■■■■■■■■■■■■■■■■■■■■■■■■■■■■■■ ■ [USER PROMPT] ■ ➔ [VECTOR SEARCH] ■ ➔ [LLM PROMPT] ■ ➔ [SANDBOX RUN] ■ ■ "Top 5 Cities" ■ Inject DDL Specs ■ Generate Python ■ Exec & Validate ■ ■■■■■■■■■■■■■■■■■■■■■■■■■■■■■■■■■■■■■■■■■■■■■■■■■■■■■■■■■■■■■■■■■■■■■■■■■■■■■■■
DATA & ANALYTICS ARCHITECTURAL PLAYBOOK 2026 Page 1
DATA ARCHITECTURE & LAKEHOUSE
Medallion Lakehouse Pattern: Bronze, Silver & Gold Pipeline Organizing Unstructured & Batch Ingestion into Audit-Ready Business Datamarts The Medallion Architecture structures data processing into three distinct layers to enforce data quality and lineage. Raw transactional logs enter the Bronze layer, get sanitized/deduplicated in Silver, and aggregated into dimensional star-schemas in Gold. • Bronze Layer (Raw): Append-only immutable store retaining exact source payloads and ingestion timestamps. • Silver Layer (Cleansed): Deduplicated, type-casted, schema-enforced records with null imputation. • Gold Layer (Business): Dimensional star-schema models (Fact & Dimension tables) optimized for BI queries.
■■■■■■■■■■■■■■■■■■■■■■■■■■■■■■■■■■■■■■■■■■■■■■■■■■■■■■■■■■■■■■■■■■■■■■■■■■■■■■■ ■ MEDALLION LAKEHOUSE DATA FLOW ■ ■■■■■■■■■■■■■■■■■■■■■■■■■■■■■■■■■■■■■■■■■■■■■■■■■■■■■■■■■■■■■■■■■■■■■■■■■■■■■■■ ■ [BRONZE LAYER] ■ ➔ [SILVER LAYER] ■ ➔ [GOLD LAYER] ■ ■ Raw Ingestion Stream■ Deduplicated & ■ Star-Schema BI Marts ■ ■ (JSON/CSV/Parquet) ■ Schema Enforcement■ (FactSales, DimCustomer) ■ ■■■■■■■■■■■■■■■■■■■■■■■■■■■■■■■■■■■■■■■■■■■■■■■■■■■■■■■■■■■■■■■■■■■■■■■■■■■■■■■
PYTHON & HIGH-PERFORMANCE COMPUTING
Polars Lazy Evaluation & Apache Arrow Memory Pattern Sub-Second Transformations on Multi-Gigabyte CSV/Parquet Exports without Out-Of-Memory Crashes Pandas single-threaded eagerly evaluated architecture hits memory bottlenecks on datasets exceeding RAM. Polars uses Apache Arrow zero-copy memory buffers and a query planner that parallelizes execution across all CPU threads while fusing filtering/projection pushdowns. • Lazy Execution: Build query graph with pl.scan_parquet(); execute with .collect(). • Predicate Pushdown: Filter data at file scan time to avoid loading unnecessary columns into memory. • Expression Engine: Perform complex window functions natively in Rust without Python GIL lock.
■■■■■■■■■■■■■■■■■■■■■■■■■■■■■■■■■■■■■■■■■■■■■■■■■■■■■■■■■■■■■■■■■■■■■■■■■■■■■■■ ■ POLARS LAZY QUERY ENGINE VS PANDAS ■ ■■■■■■■■■■■■■■■■■■■■■■■■■■■■■■■■■■■■■■■■■■■■■■■■■■■■■■■■■■■■■■■■■■■■■■■■■■■■■■■ ■ [POLARS LAZY ENGINE ■] ■ [PANDAS EAGER ENGINE ■] ■ ■ Scan ➔ Optimize ➔ Parallel Threads ■ Load All ➔ Single-Thread ➔ Memory Peak■ ■■■■■■■■■■■■■■■■■■■■■■■■■■■■■■■■■■■■■■■■■■■■■■■■■■■■■■■■■■■■■■■■■■■■■■■■■■■■■■■
DATA & ANALYTICS ARCHITECTURAL PLAYBOOK 2026 Page 2
SPREADSHEET ARCHITECTURE
Dynamic Array Framework & LAMBDA Functions in Excel Building Living Financial & Operational Models without Dragging Formulas Down Rows Modern Excel leverages dynamic array formulas (`FILTER`, `UNIQUE`, `MAP`, `REDUCE`) that spill natively into adjacent cells. Combining `LAMBDA` with parameter inputs allows building reusable custom functions that run modular business logic across variable row counts. • Single-Cell Spill: =FILTER(Data, (Category="Electronics") * (Sales>100)) auto-expands. • Custom LAMBDAs: =LAMBDA(cost, rev, IFERROR((rev - cost)/cost, 0)) defined in Name Manager. • Dynamic Lookup: Replace VLOOKUP with XLOOKUP(key, lookup_col, return_col, "Missing").
■■■■■■■■■■■■■■■■■■■■■■■■■■■■■■■■■■■■■■■■■■■■■■■■■■■■■■■■■■■■■■■■■■■■■■■■■■■■■■■ ■ DYNAMIC ARRAY SPILL ARCHITECTURE ■ ■■■■■■■■■■■■■■■■■■■■■■■■■■■■■■■■■■■■■■■■■■■■■■■■■■■■■■■■■■■■■■■■■■■■■■■■■■■■■■■ ■ [FORMULA CELL]■ =FILTER(SalesData[NetSales], SalesData[City]="Tehran") ■ ■ [SPILL RANGE] ■ ➔ Auto-populates rows 2 to N dynamically without formula drag■ ■■■■■■■■■■■■■■■■■■■■■■■■■■■■■■■■■■■■■■■■■■■■■■■■■■■■■■■■■■■■■■■■■■■■■■■■■■■■■■■
DASHBOARD DESIGN & BUSINESS INTELLIGENCE
The Pre-Attentive Visual Hierarchy & Executive KPI Grid Pattern Designing Scannable Dashboards That Drive C-Suite Action in Under 10 Seconds Executive dashboards suffer from cognitive overload when packed with unfiltered charts. By structuring views around visual pre-attentive processing (position, size, contrast) and standardizing 3-second diagnostic cards, leadership instantly spots variances. • F-Pattern Layout: Top row for Primary KPIs ➔ Middle for Trend Comparison ➔ Bottom for Granular Drilldown. • Variance Indicators: Pair metric with Target + Delta percentage (e.g., $1.2M | +8.4% vs Budget). • Color Budget Rule: Use muted grays for 80% of layout; reserve bold accent colors strictly for anomalies.
■■■■■■■■■■■■■■■■■■■■■■■■■■■■■■■■■■■■■■■■■■■■■■■■■■■■■■■■■■■■■■■■■■■■■■■■■■■■■■■ ■ EXECUTIVE DASHBOARD GRID MATRIX ■ ■■■■■■■■■■■■■■■■■■■■■■■■■■■■■■■■■■■■■■■■■■■■■■■■■■■■■■■■■■■■■■■■■■■■■■■■■■■■■■■ ■ [PRIMARY KPI: REVENUE] ■ [SECONDARY KPI: CPA] ■ [TERTIARY KPI: ROAS] ■ ■ $1,215,613 (+12.4% YoY) ■ $13.15 (-4.2% vs Mtd) ■ 3.85x (+0.4x vs Target) ■ ■■■■■■■■■■■■■■■■■■■■■■■■■■■■■■■■■■■■■■■■■■■■■■■■■■■■■■■■■■■■■■■■■■■■■■■■■■■■■■■ ■ [30-DAY TREND SPARKLINE & VARIANCE HEATMAP] ■ ■■■■■■■■■■■■■■■■■■■■■■■■■■■■■■■■■■■■■■■■■■■■■■■■■■■■■■■■■■■■■■■■■■■■■■■■■■■■■■■
DATA & ANALYTICS ARCHITECTURAL PLAYBOOK 2026 Page 3
EXPERIMENTATION & CAUSAL INFERENCE
CUPED Variance Reduction & A/B Testing Guardrails Accelerating Experiment Duration by 40% While Shielding Against Sample Ratio Mismatch Controlled online experiments often require weeks to reach statistical significance. CUPED (Controlled-experiment Using Pre-Experiment Data) utilizes pre-experiment metrics as a covariate to reduce variance in the primary KPI without introducing bias. • CUPED Adjustment: Y_adjusted = Y - θ * (X - E[X]) where θ is covariance(Y,X)/variance(X). • SRM Health Check: Run Chi-Square Goodness-of-Fit test on traffic split before calculating p-values. • Sequential Testing: Apply Pocock or O'Brien-Fleming boundaries to prevent false positives from peeking.
■■■■■■■■■■■■■■■■■■■■■■■■■■■■■■■■■■■■■■■■■■■■■■■■■■■■■■■■■■■■■■■■■■■■■■■■■■■■■■■ ■ CUPED VARIANCE REDUCTION EXPERIMENT FLOW ■ ■■■■■■■■■■■■■■■■■■■■■■■■■■■■■■■■■■■■■■■■■■■■■■■■■■■■■■■■■■■■■■■■■■■■■■■■■■■■■■■ ■ [PRE-DATA (X)] ■ ➔ [TRAFFIC SPLIT] ■ ➔ [EXPERIMENT (Y)]■ ➔ [CUPED ADJUST] ■ ■ Covariate Baseline■ 50% A / 50% B ■ Measure Metrics ■ 40% Lower Variance■ ■■■■■■■■■■■■■■■■■■■■■■■■■■■■■■■■■■■■■■■■■■■■■■■■■■■■■■■■■■■■■■■■■■■■■■■■■■■■■■■
PREDICTIVE ML & FEATURE ENGINEERING
Offline-to-Online Feature Store Pattern for Predictive Pipelines Eliminating Training-Serving Skew in Real-Time Customer LTV & Churn Scoring Models Machine learning models fail in production when features engineered during offline batch training differ from online real-time inference inputs. A unified Feature Store enforces point-in-time correctness and consistent transformations across batch and stream pipelines. • Point-in-Time Joins: Prevent data leakage by joining entity timestamps with historical feature snapshots. • Online Store (Redis): Sub-10ms key-value latency for real-time model inference endpoints. • Drift Monitoring: Monitor Population Stability Index (PSI) and Wasserstein Distance to detect feature shift.
■■■■■■■■■■■■■■■■■■■■■■■■■■■■■■■■■■■■■■■■■■■■■■■■■■■■■■■■■■■■■■■■■■■■■■■■■■■■■■■ ■ UNIFIED FEATURE STORE & INFERENCE FLOW ■ ■■■■■■■■■■■■■■■■■■■■■■■■■■■■■■■■■■■■■■■■■■■■■■■■■■■■■■■■■■■■■■■■■■■■■■■■■■■■■■■ ■ [BATCH / STREAM] ■ ➔ [FEATURE STORE] ■ ➔ [MODEL INFERENCE ENDPOINT] ■ ■ Kafka / Snowflake ■ Offline (Parquet) ■ Batch ML Training (XGBoost) ■ ■ Stream Aggregation ■ Online (Redis) ■ Real-Time API Latency < 15ms ■ ■■■■■■■■■■■■■■■■■■■■■■■■■■■■■■■■■■■■■■■■■■■■■■■■■■■■■■■■■■■■■■■■■■■■■■■■■■■■■■■
DATA & ANALYTICS ARCHITECTURAL PLAYBOOK 2026 Page 4