Automation · PDF · 12 pages
Automating Monthly PDF Reports with pandas + ReportLab
Build, style, schedule and send your monthly reports automatically with Python.
 Download original guide
Inside the guide
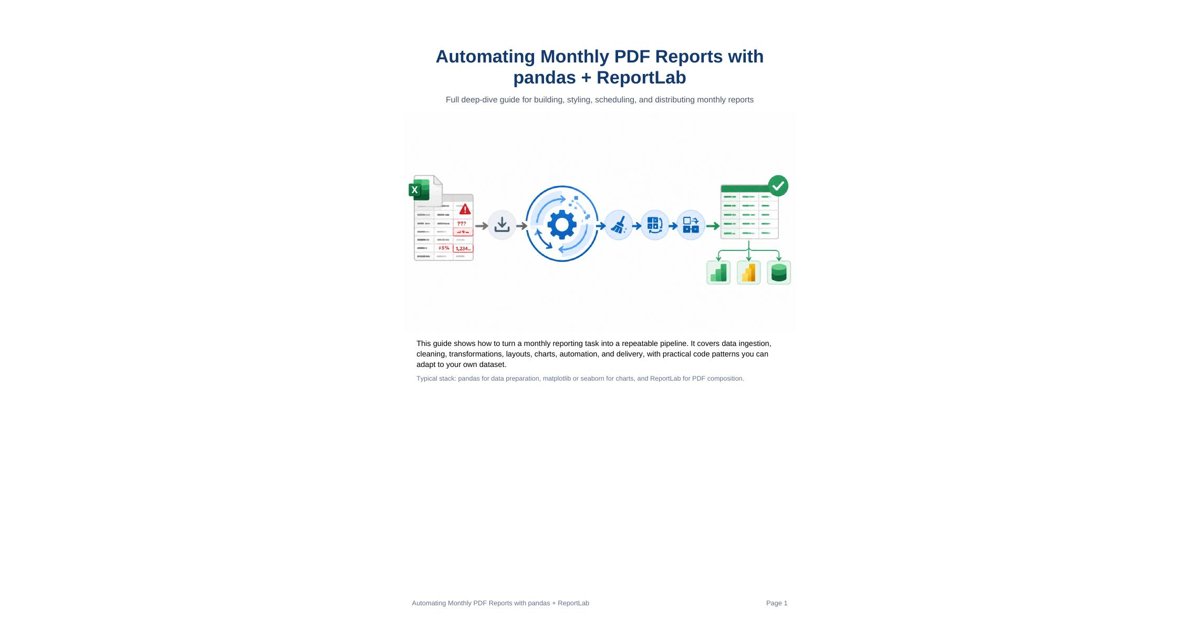
Automating Monthly PDF Reports with pandas + ReportLab Full deep-dive guide for building, styling, scheduling, and distributing monthly reports
This guide shows how to turn a monthly reporting task into a repeatable pipeline. It covers data ingestion, cleaning, transformations, layouts, charts, automation, and delivery, with practical code patterns you can adapt to your own dataset. Typical stack: pandas for data preparation, matplotlib or seaborn for charts, and ReportLab for PDF composition.
Automating Monthly PDF Reports with pandas + ReportLab Page 1
Contents 1. What the workflow looks like 2. Folder structure and project setup 3. Data ingestion with pandas 4. Cleaning and validation rules 5. Monthly calculations and KPIs 6. Charts and visual storytelling 7. ReportLab layout architecture 8. Building reusable report components 9. Scheduling and automation 10. Logging, testing, and error handling 11. Practical code blueprint 12. Production checklist and next steps
Automating Monthly PDF Reports with pandas + ReportLab Page 2
1. What the workflow looks like The cleanest monthly reporting systems follow the same shape every time. Source files arrive, pandas prepares a trusted dataset, the report engine formats the output, and an automated job distributes the finished PDF.
The main benefit is consistency. If you separate data logic from layout logic, the report stays easier to maintain when the business changes.
Stage Goal
Ingest Read files, databases, or APIs into pandas
Transform Clean columns, standardize formats, merge tables
Aggregate Compute monthly KPIs and comparisons
Render Turn data and charts into a formatted PDF
Deliver Save, email, archive, and log the run
Automating Monthly PDF Reports with pandas + ReportLab Page 3
2. Folder structure and project setup A simple structure makes the automation easier to debug and easier to scale. Keep raw data, output files, templates, code, and logs separate. project/ data/ raw/ processed/ reports/ monthly/ assets/ images/ logo/ templates/ src/ load_data.py clean_data.py build_report.py send_email.py logs/ config/ settings.yaml
Useful packages usually include pandas, reportlab, matplotlib, openpyxl if Excel input is needed, and a scheduler such as cron, Windows Task Scheduler, Airflow, or a serverless job runner.
3. Data ingestion with pandas Your ingestion layer should handle more than one source. Many monthly reports combine CSV exports, Excel sheets, and a database extract. Load them into pandas with consistent column naming so the downstream logic stays simple.
The important habit is to make each source predictable as early as possible. Rename columns, parse dates, and convert numbers before you start calculating metrics.
Example loading pattern: import pandas as pd
sales = pd.read_csv('data/raw/sales_2026_05.csv')
Automating Monthly PDF Reports with pandas + ReportLab Page 4
expenses = pd.read_excel('data/raw/expenses_2026_05.xlsx', sheet_name='Sheet1') orders = pd.read_sql_query(query, connection)
sales.columns = sales.columns.str.strip().str.lower().str.replace(' ', '_')
4. Cleaning and validation rules Monthly reports fail when the data is inconsistent. Missing values, duplicate rows, invalid dates, and mixed data types should all be handled before reporting begins.
Good validation usually checks row counts, key uniqueness, required columns, date ranges, and category values. If the report is business critical, keep a separate exception file for rows that fail validation.
Example cleaning pattern: df = df.copy() df.columns = df.columns.str.lower().str.strip() df['order_date'] = pd.to_datetime(df['order_date'], errors='coerce') df['amount'] = pd.to_numeric(df['amount'], errors='coerce') df = df.drop_duplicates(subset=['order_id']) df['region'] = df['region'].fillna('Unknown')
5. Monthly calculations and KPIs The report should answer the same business questions every month. Examples include revenue, margin, order volume, top categories, month over month change, year to date totals, and exceptions. A strong monthly summary usually includes both the current period and a comparison column so readers can see trend direction immediately.
Metric Formula idea
Revenue sum of amount
Orders row count or distinct order count
Average order value revenue divided by orders
Month over month change (current - previous) / previous
YTD total cumulative sum within the year
Automating Monthly PDF Reports with pandas + ReportLab Page 5
If you later add a chart, make sure the metric definition in the chart matches the definition in the text. Mismatched totals create confusion very quickly.
Automating Monthly PDF Reports with pandas + ReportLab Page 6
6. Charts and visual storytelling A monthly PDF report usually needs a few compact visuals rather than a large dashboard. The most useful charts are trend lines, bar charts, category comparisons, and exception summaries. The goal is not to overload the reader. The goal is to make the monthly movement obvious in one glance.
For chart building, generate the figure in matplotlib first, then insert the PNG into ReportLab. That keeps plotting and layout responsibilities separate.
Typical chart workflow: import matplotlib.pyplot as plt
fig, ax = plt.subplots(figsize=(8, 3)) ax.plot(months, revenue, marker='o') ax.set_title('Revenue Trend') fig.tight_layout() fig.savefig('assets/images/revenue_trend.png', dpi=200, bbox_inches='tight')
7. ReportLab layout architecture ReportLab works best when you think in page structure instead of rows and columns only. Use styles, paragraphs, spacers, tables, page templates, and headers or footers to build a clean story flow.
Automating Monthly PDF Reports with pandas + ReportLab Page 7
The layout stack often looks like this: cover page, executive summary, KPI cards, detail tables, notes, and appendix. If the document is long, add repeated headers and page numbers so it remains usable when printed.
Useful building blocks: from reportlab.platypus import SimpleDocTemplate, Paragraph, Spacer, Table, Image from reportlab.lib.styles import getSampleStyleSheet
story = [] story.append(Paragraph('Monthly Sales Report', title_style)) story.append(Spacer(1, 12)) story.append(table_object) story.append(Image('assets/images/trend.png', width=400, height=180))
Automating Monthly PDF Reports with pandas + ReportLab Page 8
8. Building reusable report components Once the report structure is stable, break it into reusable components. For example, one function can build KPI cards, one function can build a summary table, and one function can build the footer.
This is the same idea as reusable functions in Power Query. Encapsulate logic once, then apply it every month with new inputs.
Example helper functions: def make_kpi_card(title, value, delta): return ...
def make_summary_table(df): return ...
def add_header(canvas, doc): canvas.drawString(40, 800, 'Monthly Report')
9. Scheduling and automation A report is only truly automated if it runs on schedule without manual intervention. That usually means a Python script launched by cron, a scheduler service, Airflow, a CI job, or a cloud function.
Automating Monthly PDF Reports with pandas + ReportLab Page 9
Common steps in the automation run are fetch data, validate, render PDF, save output, send email, and archive the file with a timestamp. If any step fails, log the reason and stop cleanly.
A simple monthly cron style example: 0 8 1 * * /usr/bin/python3 /app/src/build_monthly_report.py
On Windows, use Task Scheduler. On managed infrastructure, use a job runner with proper secrets management and retry policy.
Automating Monthly PDF Reports with pandas + ReportLab Page 10
10. Logging, testing, and error handling Monthly reporting should be boring in the best way. That only happens when the script has enough logging to explain what happened and enough tests to catch expected data problems early.
Recommended checks: • Source files exist and are not empty • Required columns are present • Row counts are within expected bounds • Numeric columns parse correctly • Date ranges are valid for the reporting month • Output PDF was created successfully • Email or distribution step completed If a check fails, write a short log entry that can be read by a human later. That makes the monthly run easier to maintain when the original developer is not around.
11. Practical code blueprint The script usually works best when split into small stages. Here is a minimal blueprint: load_data() clean_data() calculate_metrics() build_charts() render_pdf() send_email() archive_report()
A production version would also load configuration from a file, use templates for styling, and separate business rules from formatting code.
Example end-to-end skeleton: def main(report_month): df = load_data(report_month) df = clean_data(df) metrics = calculate_metrics(df) charts = build_charts(df, metrics) output = render_pdf(metrics, charts, report_month) send_email(output) archive_report(output, report_month)
if __name__ == '__main__': main('2026-05')
Automating Monthly PDF Reports with pandas + ReportLab Page 11
12. Production checklist and next steps Before calling the project complete, confirm the following: • The report works for at least two different months of data • The PDF opens correctly and page breaks look clean • Charts are readable at print size • Nulls and bad values do not break the pipeline • The output file name includes the month or run date • Logs make it easy to diagnose failures • The job is scheduled and tested in the target environment
Final takeaway A good monthly PDF reporting system is a small data product. pandas prepares the numbers, ReportLab packages the story, and automation makes the whole thing repeat itself reliably every month. If you want the highest leverage improvement, keep the data logic and the presentation logic separate from the start. This helps when you need to add new KPIs, new charts, or a new recipient group later without rebuilding the whole solution.
Automating Monthly PDF Reports with pandas + ReportLab Page 12